Overview
Application Insights is a set of tools within Azure Monitor that allow you to store metrics, telemetry data, and logs for future analysis.
But how long should you retain this data? There is a cost to storing it and managing that storage. We have options:
- Keep the data forever
- Keep the data for a predetermined time period; then, delete it
- Keep the data for a predetermined time period; then, move it to "cold storage" for long-term retention.
Application Insights supports each of these options. Archiving and retention of Application metrics is managed within the "Diagnostic settings" section.
Configuring Retention
To begin, log into the Azure Portal and navigate to the "Azure Monitor", as shown in Fig. 1.
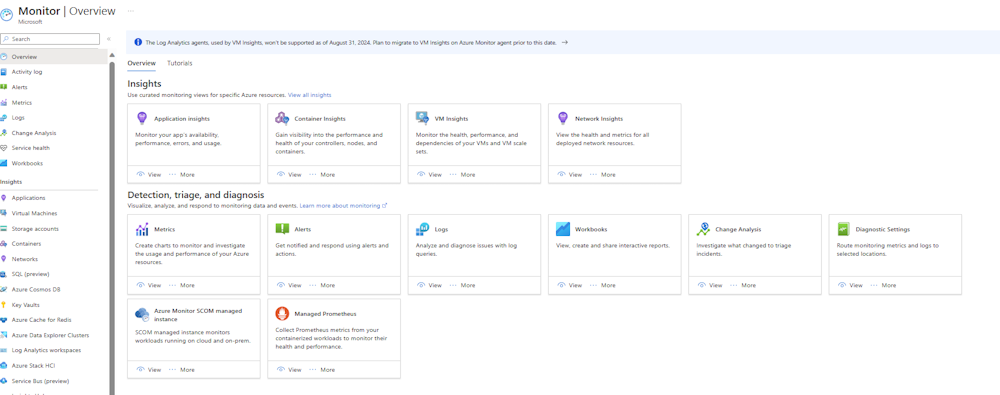
Fig. 1
In the left menu, click the [Applications] button to display the "Applications" blade, as shown in Fig. 2.

Fig. 2
Select the Application for which you wish to configure archiving and retention. Application details will display with the application's "Overview" blade selected, as shown in Fig. 3

Fig. 3
Click the [Diagnostic setting] button of the "Monitoring" section of the left menu (Fig. 4) to display the "Diagnostic setting" blade, as shown in Fig. 5.
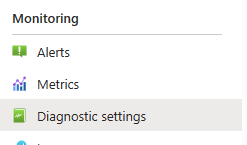
Fig. 4

Fig. 5
Click the [Add diagnostic setting] button (Fig. 6) to display the "Diagnostic setting" dialog, as shown in Fig. 7.

Fig. 6
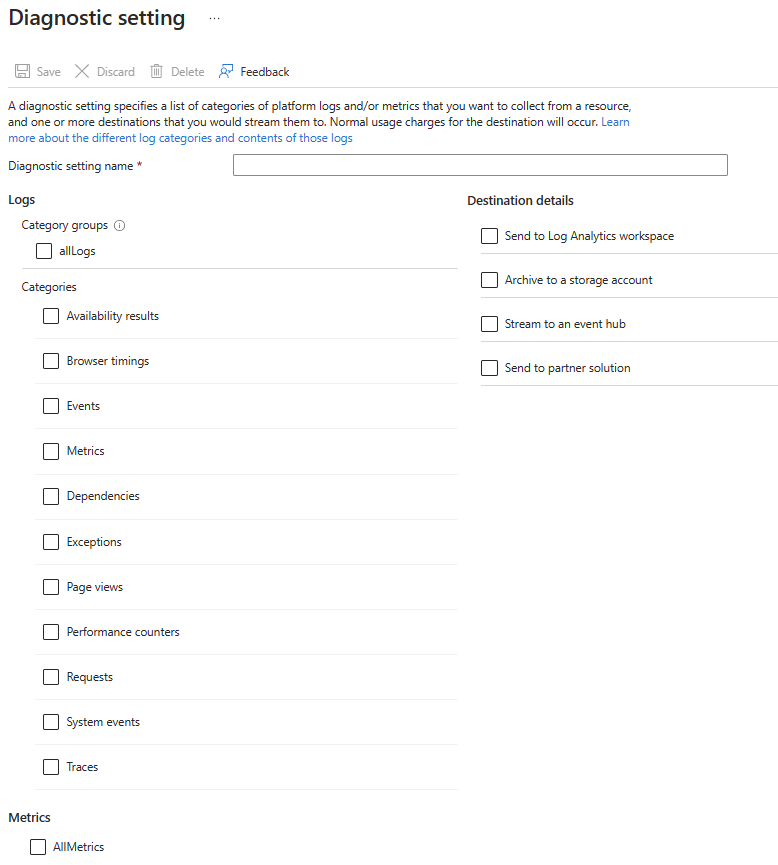
Fig. 7
At the "Diagnostic setting name" field, enter a name for this set of configuration settings.
The left side of this dialog lists different types of data that Azure Monitor captures. You can manage a set of data by checking the checkbox next to that item. Check the [allLogs] checkbox to checkbox to check everything under the Logs Categories section.
Fig. 8 shows several of the categories checked, along with the all the metrics.
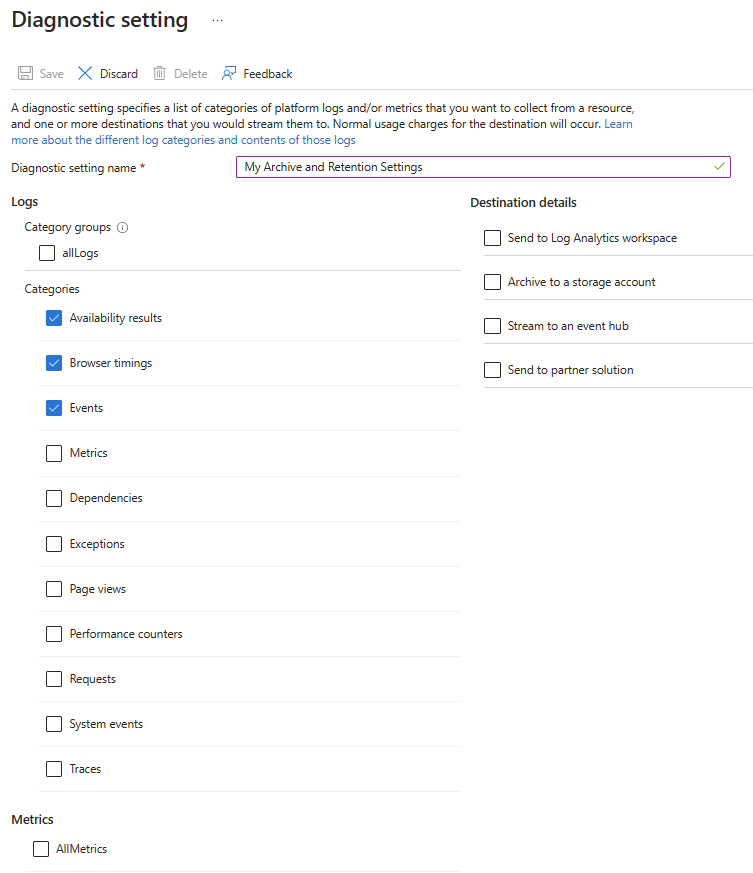
Fig. 8
On the right side of the "Diagnostic setting" dialog, you tell Azure what action to take on the checked metrics. This article concerns archiving and retention, so Fig. 9 shows additional prompts displayed when you check the "Archive to a storage account" checkbox.
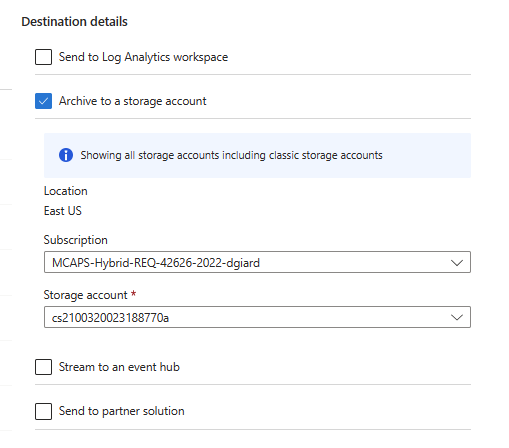
Fig. 9
Select the Azure subscription and storage account into which you wish to move the metric data after Azure deletes it from the Monitor database. The Storage account must be in the same region as the logs.
In addition, you can set the retention days, indicating how long a record will remain in the storage account before it is automatically deleted. Setting the retention to 0 indicates that the data will never be deleted automatically. Fig. 10 shows these settings.
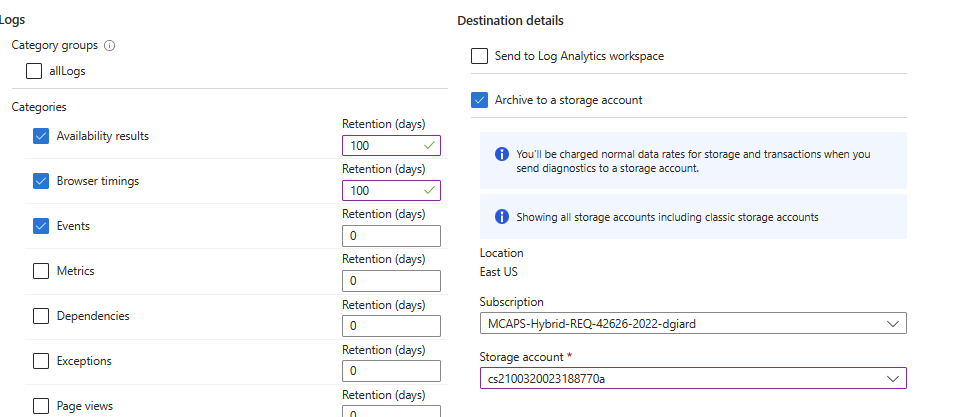
Fig. 10
Click the [Save] button (Fig. 11) to commit all the settings you have made in this dialog.

Fig. 11
Conclusion
In this article, you learned how to configure retention for Azure Application Insights Logs and Metrics
References
https://learn.microsoft.com/en-us/azure/azure-monitor/essentials/diagnostic-settings