Overview
Application Insights is a set of tools within Azure Monitor. These tools allow you to view the performance of your application or service quickly and to review detailed information to determine the causes of an incident. Using Application Insights, you can configure your applications to store metrics, telemetry data, and logs for future analysis.
A convenient way to present the collected data is using a Dashboard - a single screen that presents multiple views of one or more data sets. A Dashboard allows the user to quickly get a snapshot of important information.
Building a Dashboard
To begin, log into the Azure Portal and navigate to the "Azure Monitor", as shown in Fig. 1.
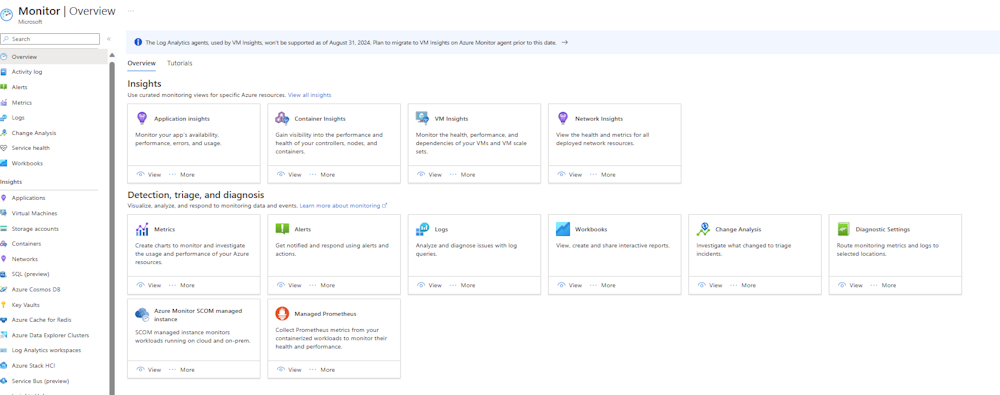
Fig. 1
In the left menu, click the [Applications] button to display the "Applications" blade, as shown in Fig. 2.

Fig. 2
Select the Application for which you wish to create a Dashboard. Application details will display with the application's "Overview" blade selected, as shown in Fig. 3

Fig. 3
A default Dashboard is created for this application. Click the [Application Dashboard] button (Fig. 4) to display this default Dashboard, as shown in Fig. 5.

Fig. 4
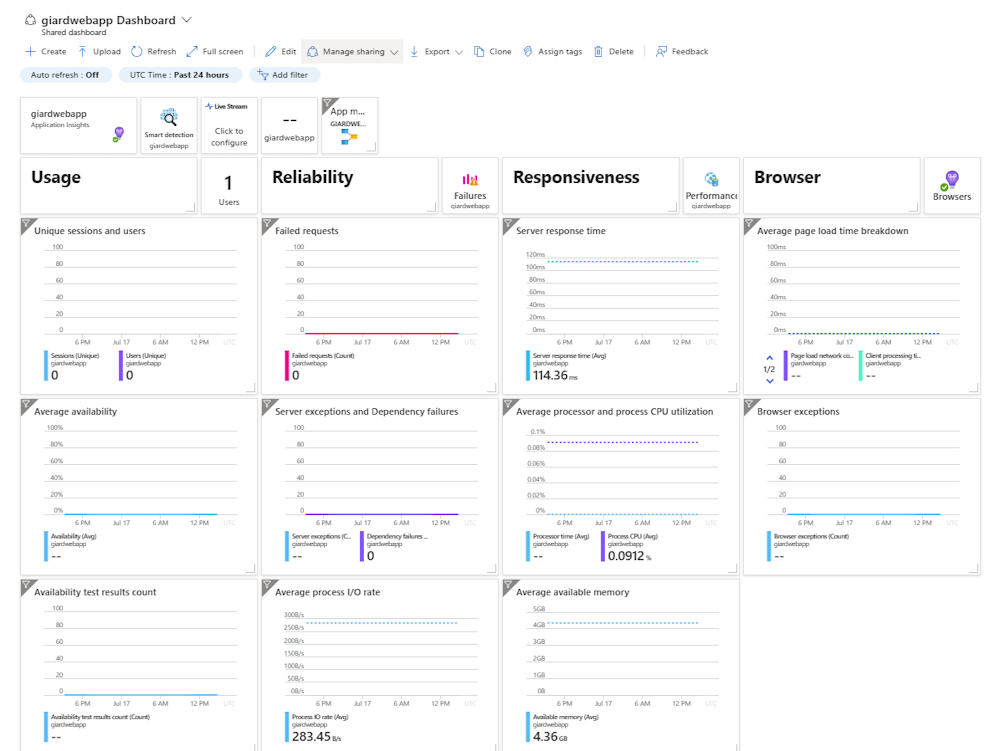
Fig. 5
You can accept this default Dashboard as-is, or you can edit it, or you can create a new one.
To create a new Dashboard, click the [Create] button (Fig. 6) to display the "Create a Dashboard" dialog, as shown in Fig. 7.

Fig. 6

Fig. 7
Select one of the templates displayed in this dialog to begin with a Dashboard containing some initial visualizations or select the "Custom" template to begin with an empty Dashboard. The "Create an Application Insights dashboard" dialog displays, as shown in Fig. 8.
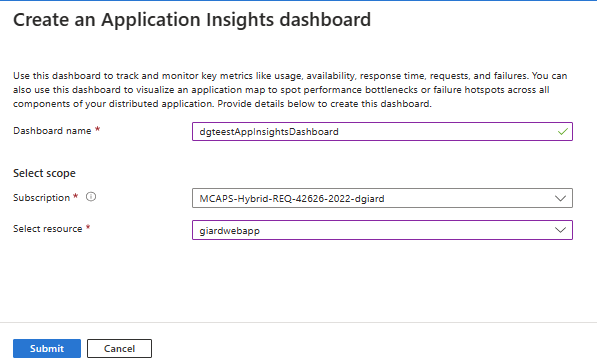
Fig. 8
At the "Dashboard name" field, enter a descriptive name for this new Dashboard.
At the "Subscription" field, select the Azure Subscription into which this Dashboard will be stored. Many of you will have only one Azure subscription.
At the "Select resource" field, select the resource the Azure resource for which you wish to see visualizations.
Click the [Submit] button to create the Dashboard.
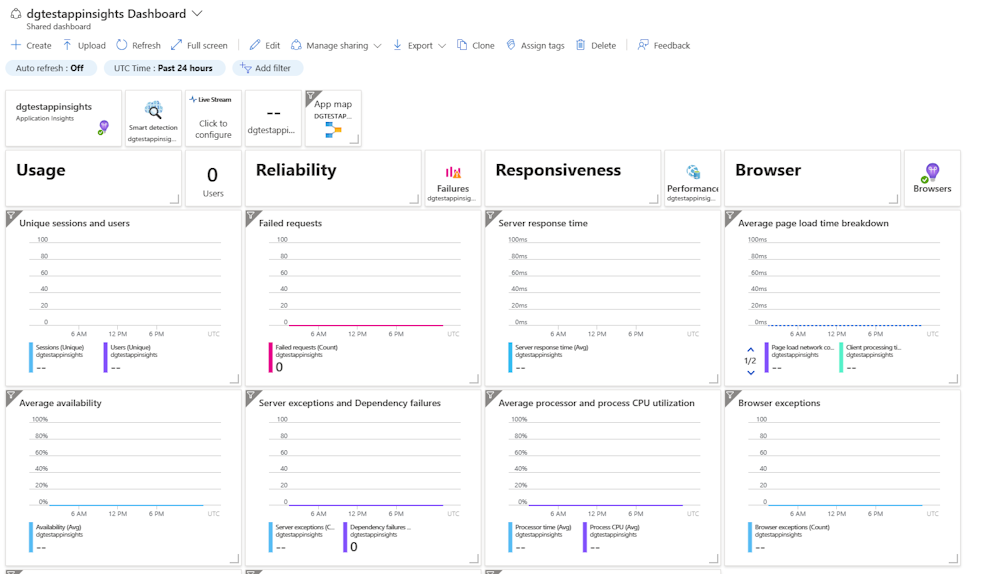
Fig. 9 shows a newly created dashboard for an Azure App Service.
Fig. 9
You can edit any Dashboard. With this (or any) Dashboard displayed, click the [Edit} button (Fig. 10) to place the Dashboard into Edit mode. In Edit mode, you can add new Tiles, delete existing Tiles, and drag a Tile to move it to a new location on the screen.

Fig. 10
To add a new Tile, click the [Add Tiles] button (Fig. 11), which displays the "Tile Gallery" dialog shown in Fig. 12.

Fig. 11
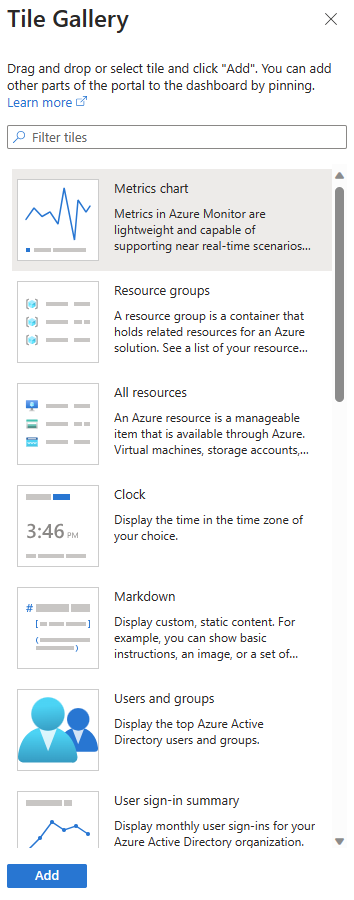
Fig. 12
Select a desired Tile template in the "Tile Gallery" dialog and click the [Add} button to add this Tile to the bottom of the Dashboard.
To configure the Tile, click the [Context] button (Fig. 13) in the Tile's top-right corner to display the Context menu (Fig 14) and select "Configure Tile settings" to display the "Configure Tile settings" dialog, as shown in Fig. 15. (NOTE: The context menu button may not appear until you hover over it.)

Fig. 13
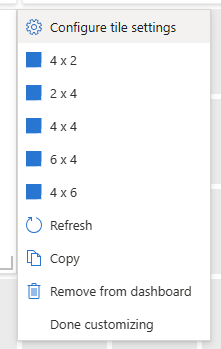
Fig. 14
The "Configure Tile settings" dialog allows you to override the time span for this Tile (by default the past 24 hours, as inherited from the Dashboard") and set filter settings. Fig. 15 shows a sample "Configure Tile settings" dialog.
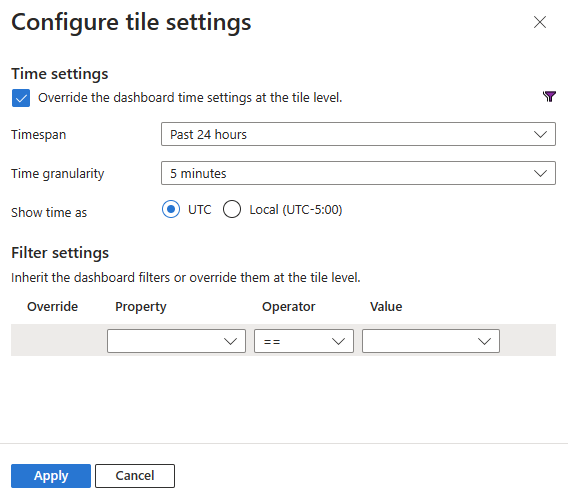
Fig. 15
Click the [Apply] button to save your configuration setting changes.
To remove a Tile, click the [Delete] button (Fig. 16) in the top right corner of the Tile. This button often will not display until you hover over it.

Fig. 16
To resize a Tile, hover over the bottom right corner until the cursor becomes a double-pointed arrow and drag to the desired size.
To move a Tile, hover over the Tile, until the cursor becomes a 4-pointed arrow and drag the Tile to the desired location.
At any time, you can click the [Preview] button (Fig. 17) to see what the Dashboard will look like when you save it.

Fig. 17
Click the [Save] button (Fig. 18) to save your changes to the Dashboard or click the [Cancel] button (Fig. 19) to discard your changes.

Fig. 18

Fig. 19
Conclusion
In this article, you learned how to create and modify an Azure Application Insights Dashboard.