Overview
Diagnostic Settings allows an Azure SQL Managed Instance to interact with Azure Monitor. You must enable and configure this feature in order to take advantage of it.
Enabling Diagnostic
Navigate to the Azure Portal and log in. Then, navigate to your Azure SQL Managed Instance, as shown in Fig. 1.
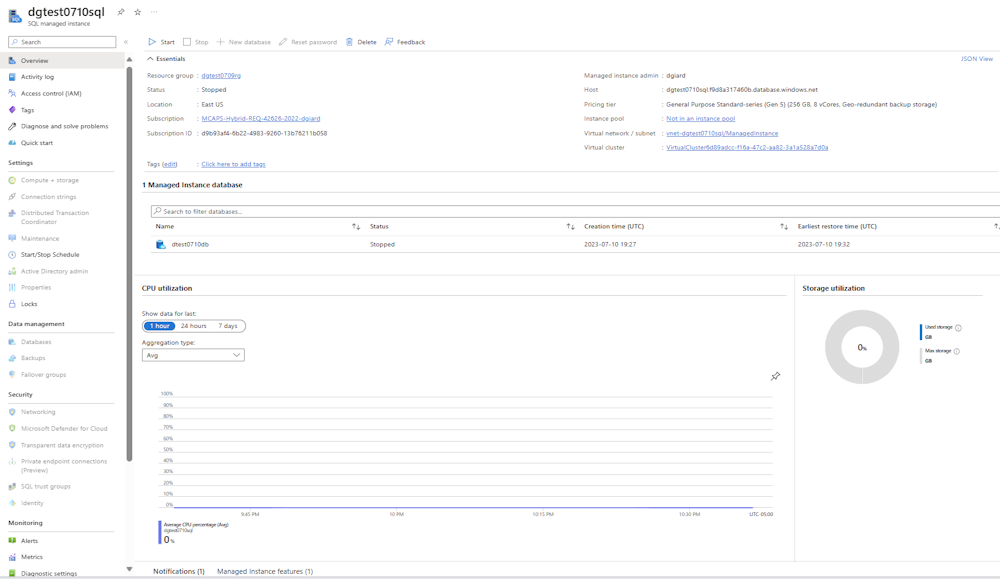
Fig. 1
From the left menu, click the [Diagnostic Settings] button in the "Monitoring" section (Fig. 2) to open the "Diagnostic Settings" blade, as shown in Fig. 3.
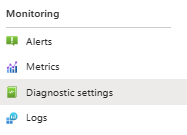
Fig. 2

Fig. 3
Click the [Add diagnostic setting] button (Fig. 4) to open the "Diagnostic setting" dialog, as shown in Fig. 5.

Fig. 4
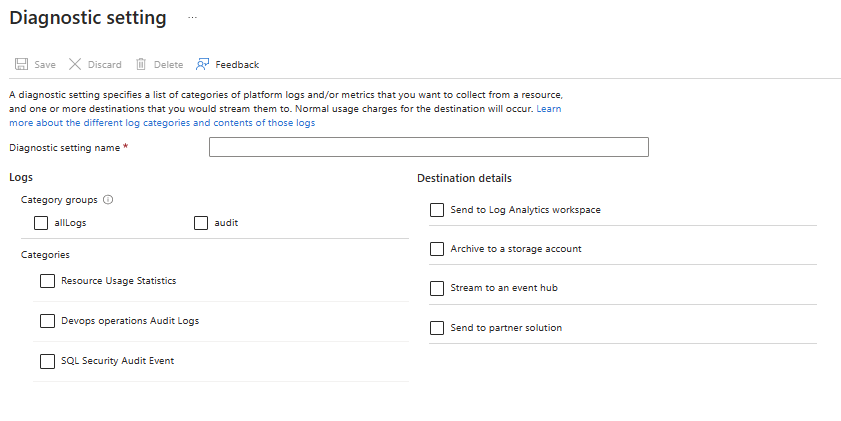
Fig. 5
The left side of this dialog allows you to select the information you want to log (Resource Usage Statistics, Devops operations Audit Logs, and SQL Security Audit Events). You may select any or all these events. Clicking the "AllLogs" checkbox checks all three categories below. Clicking the "audit" checkbox checks only the "Devops operations Audit Logs" and "SQL Security Audit Events" checkboxes.
The right side of this dialog allows you to configure a destination to send events. Clicking any of these four checkboxes displays prompts for more information.
If you check the "Send to Log Analytics workspace" checkbox, the additional prompts shown in Fig. 6 display.
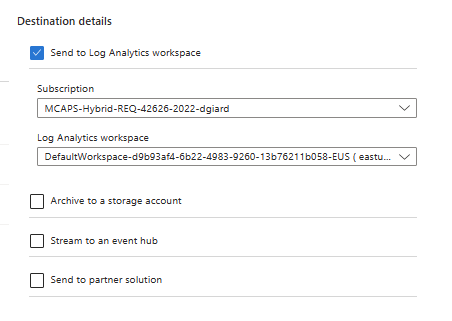
Fig. 6
Here you can select the Log Analytics workspace to which you want to send the event information. A has its own data repository and configuration.
If you check the "Archive to a storage account" checkbox, the additional prompts shown in Fig. 7 display.
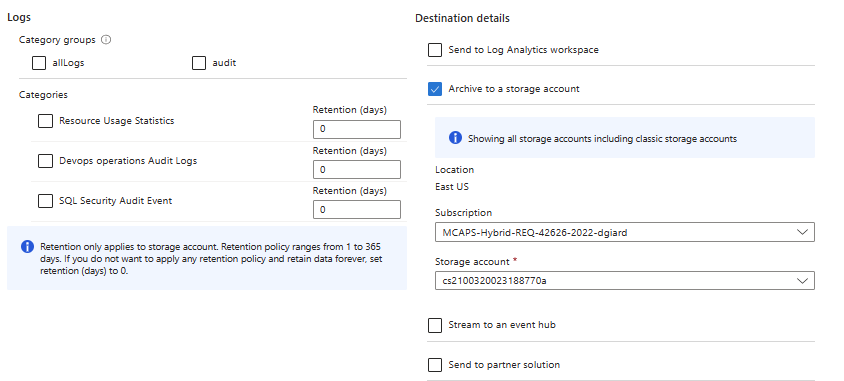
Fig. 7
Here you can select the Storage Account into which event data will be persisted.
If you check the "Stream to an event hub" checkbox, the additional prompts shown in Fig. 8 display.
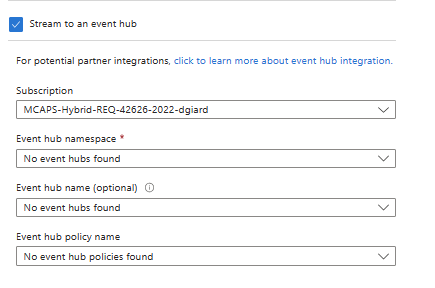
Fig. 8
Here you can select the Event Hub details to which you want to stream events collected from this SQL Managed Instance.
If you check the "Send to partner solution" checkbox, the additional prompts shown in Fig. 9 display.
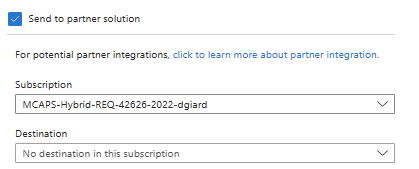
Fig. 9
Here you can select a third-party application to which you want to send your data. This is useful if you are using a tool like DataDog or Elastic to monitor your Azure applications.
Before configuring the destinations on the right side of the "Diagnostic setting" dialog, the destination must already exist. For instance, you must create the Storage Account or Event Hub before you can send data to it.
Conclusion
In this article, you learned how to enable and configure Azure Diagnostics for an Azure SQL Managed Instance.